— Life expectancy mapped by London tube stations. Unsurprisingly, the more affluent the area, the higher the life expectancy.
Posts about Maps (RSS, JSON)
Monday, 05 February 2024
Wednesday, 24 January 2024
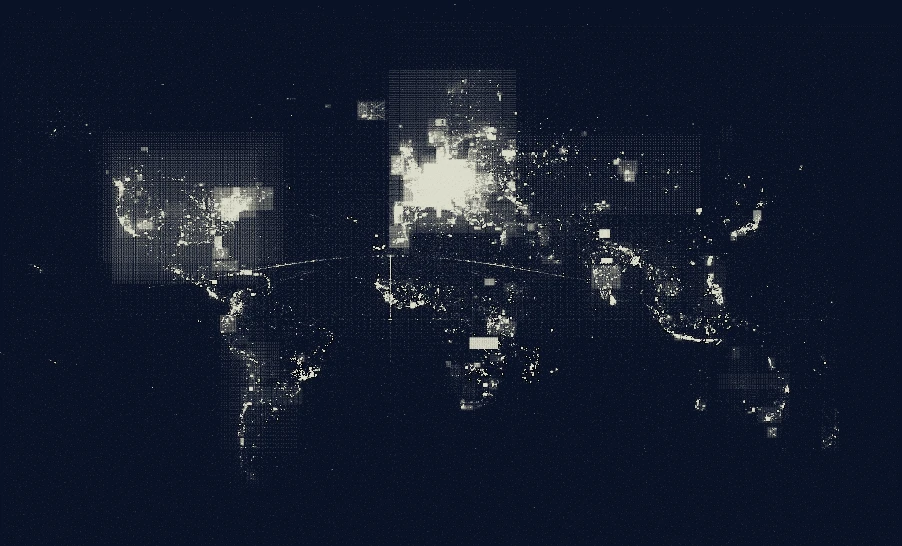
— Unzoomed is another fun game by Benjamin Td, maker of the London Tube memory game. You guess the city from a satellite image. You start at a large zoom level, the more you guess the further the map zooms out.
Monday, 18 December 2023
— A bloke in Melbourne made a hand-drawn world map featuring 1,642 animals. It took three years to complete and 2,600 hours went into the work.
Tuesday, 21 November 2023
— The Lost Subways of North America explores the history of public-transport systems on North America through a series of maps. (via)
Tuesday, 31 October 2023
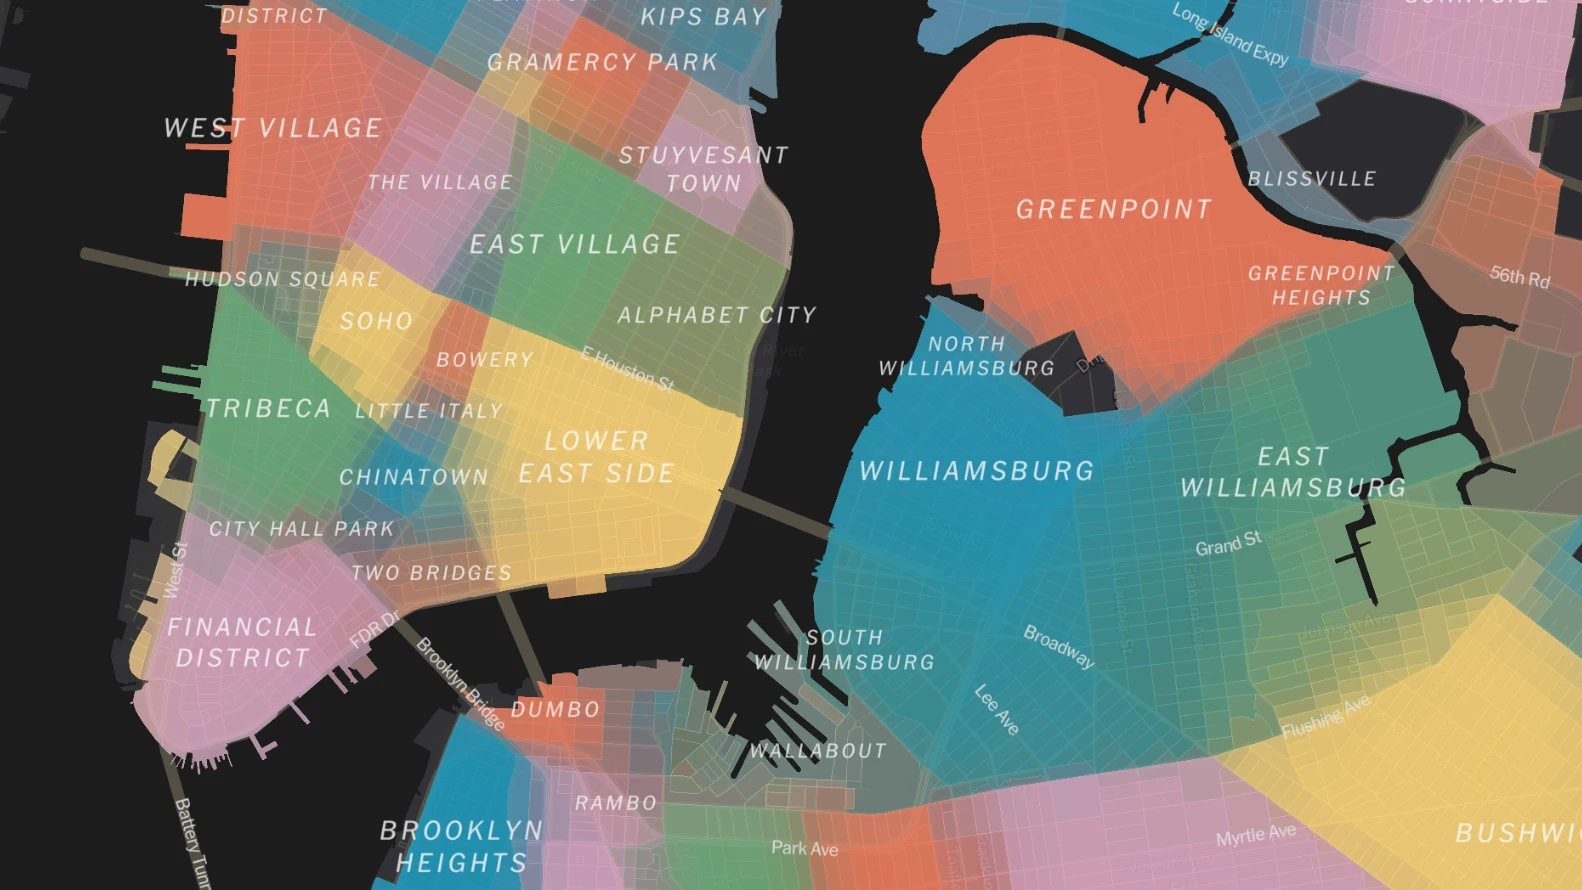
A crowd-sourced map by The New York Times shows the boundaries of New York neighbourhoods. Delineating neighbourhoods in urban areas is notoriously difficult because every resident has a different idea where their neighbourhood starts and ends. This map does a great job of showing distinct areas while also showing fuzzy transitions between them.
Thursday, 05 October 2023
— Harry Beck, creator of the iconic London tube map, also designed airline route maps. (via)
Wednesday, 27 September 2023
— The Projection Collection, basically trading cards for map nerds, will be re-printed. Order your set via Kickstarter now.
Monday, 26 June 2023
— The Vaguely Rude Place Names Map maps place names world-wide that some might find offensive, like Blowhard in Australia or Wankham in Australia. No, you grow up.
Saturday, 17 June 2023
— It took 500 hours to create The Wollongong Map, a hand-drawn panorama map that depicts the Australian city Wollongong in intricate detail. (via)
Friday, 09 June 2023
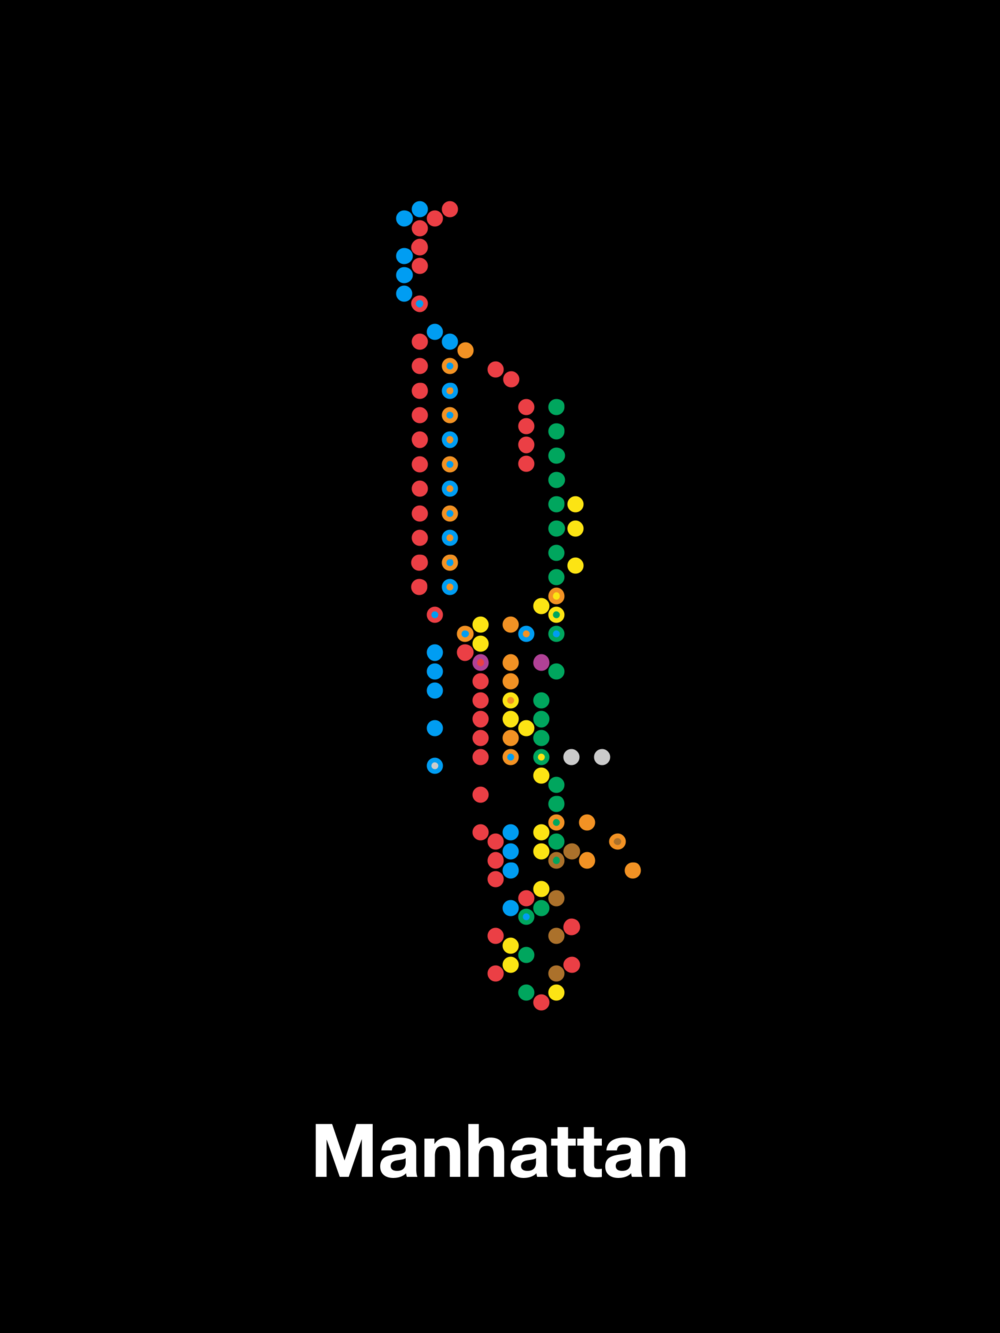
These minimalist graphics and maps from Peter Gorman are awesome.
Friday, 02 June 2023
— Null Island, a location in the Atlantic Ocean where equator and the prime meridian meet, isn’t a place but there’s still a lot happening: “people running and cycling, cyberattacks, and a lot of Covid cases.”
Friday, 26 May 2023
— Wonderful profile of Bellerby, maker of bespoke, handmade globes; explaining the intricate process:
globemakers work with gores, which pose a unique set of challenges. These long, thin, oval-shaped pieces of pre-printed paper must be carefully cut by hand and painted with a translucent wash of watercolour that lets the coastlines and place names show through. It’s a process that can take five to ten days, says Isis Linguanotto, head painter and a globemaker for ten years, who sits at a wooden workbench cluttered with jam jars of ink-coloured water, brushes and well-used paint palettes. A row of half-painted gores has been laid out flat to dry. Linguanotto will build up the thin layers of paint to shade and define borders and landforms – details as important for readability as aesthetics.
Once the painters have finished the first stage of their work, each gore is dipped in water, making it pliable (and very fragile) so that it can be stretched and carefully pasted to the fibreglass sphere. Most globes use 12 gores – larger ones may need 18 – and each must align perfectly with its neighbour, without overlapping, to ensure that every map line meets in the right spot. Overwork the paper and it will deteriorate and tear.
Just in case you were wondering why these things are so expensive.
Friday, 28 April 2023
— Updated satellite images on Google Maps show the destruction caused by Russian artillery in Ukraine.
Monday, 03 April 2023
— Researchers from the Sorbonne and New York Universities discovered a lost manuscript of Ptolemy describing the design and the use of the Meteoroscope:
Ptolemy’s Meteoroscope was a tool to calculate heights and distances, often in relation to celestial bodies. It is referenced in several ancient texts, including Ptolemy’s own book on mapmaking, the Geography. However, details of its structure and operation were lacking, until now.
[…]
You could then use it for numerous applications such as determining your latitude in degrees from the equator, the exact date of a solstice or equinox, or the apparent location of a planet in the zodiac.
Saturday, 01 April 2023
This map shows the outlines of atlases created on Field Papers. Mundane data made to look like art. (via)
Monday, 27 March 2023
— The evolution of London’s iconic Tube map in words: You know what this map needs? It won’t be intrusive, it’ll be useful.
Tuesday, 28 February 2023
— HistoryMaps explains historic events using text, videos and maps. Incredibly informative and well-designed.
Monday, 20 February 2023
— Ben Yakas, writing for the Gothamist, explores the history of the colour scheme in New York’s subway map. It explains why the map doesn’t always use unique colours to designate lines in the Subway network. Granted, New York’s Subway system has more individual lines than London’s Tube network, but I find London’s map easier to use. Unique colours mean I can trace a line on the map to see where it’s going, and wayfinding inside stations is easier, too; I can follow the right colour to find my platform. (via The Map Room)
Tuesday, 17 January 2023
While we all spent the lockdown baking bread, Jon Tordoff built a 100sqft LEGO model of the Lake District. (Via The Map Room)
Friday, 13 January 2023
— “What’s better than maps or stamps? Maps on stamps! When maps meet stamps, you get a love child called ‘cartophilately.’” Frank Jacobs, of Strange Maps fame, highlights artefacts from Gilad’s Maps on Stamps, a vast database of over 17,000 stamps with maps on them.
Friday, 06 January 2023
— An interactive map by the Violence Research Centre at the University of Cambridge shows murder locations in medieval London. Some of the descriptions are hilarious:
- “Innkeeper Stephen of Lynn murdered after winning at backgammon,”
- “Death among drunk wrestlers,” and
- “Vicious attack for dropping eel skins outside a shop.”
Others could be modern-day headlines:
- “Man lies dead in street from fatal stab wound,” or
- “Luton man stabbed in Sunday evening dispute.”
Thursday, 05 January 2023
— On Google Maps, you can see where on the moon the Apollo astronauts landed and the area they explored.
Wednesday, 21 December 2022
— The topologist’s world map is a map that is heavily distorted for compactness but with the borders between countries preserved. Is it a useful map? Not really. Does it look good? Yes, very.
Tuesday, 29 November 2022
— Geopolitics, contested borders in south and south-east Asia, have found their way onto James Cheshire’s map-themed Christmas baubles.
Thursday, 17 November 2022
— Volume 6 of the NACIS Atlas of Design has been published in October. You can preview some of the maps included in the edition, and they look delicious.
Thursday, 10 November 2022
— “The Map” is a short documentary by Gary Hustwit about the redesign of New York’s subway map and the accompanying online app.
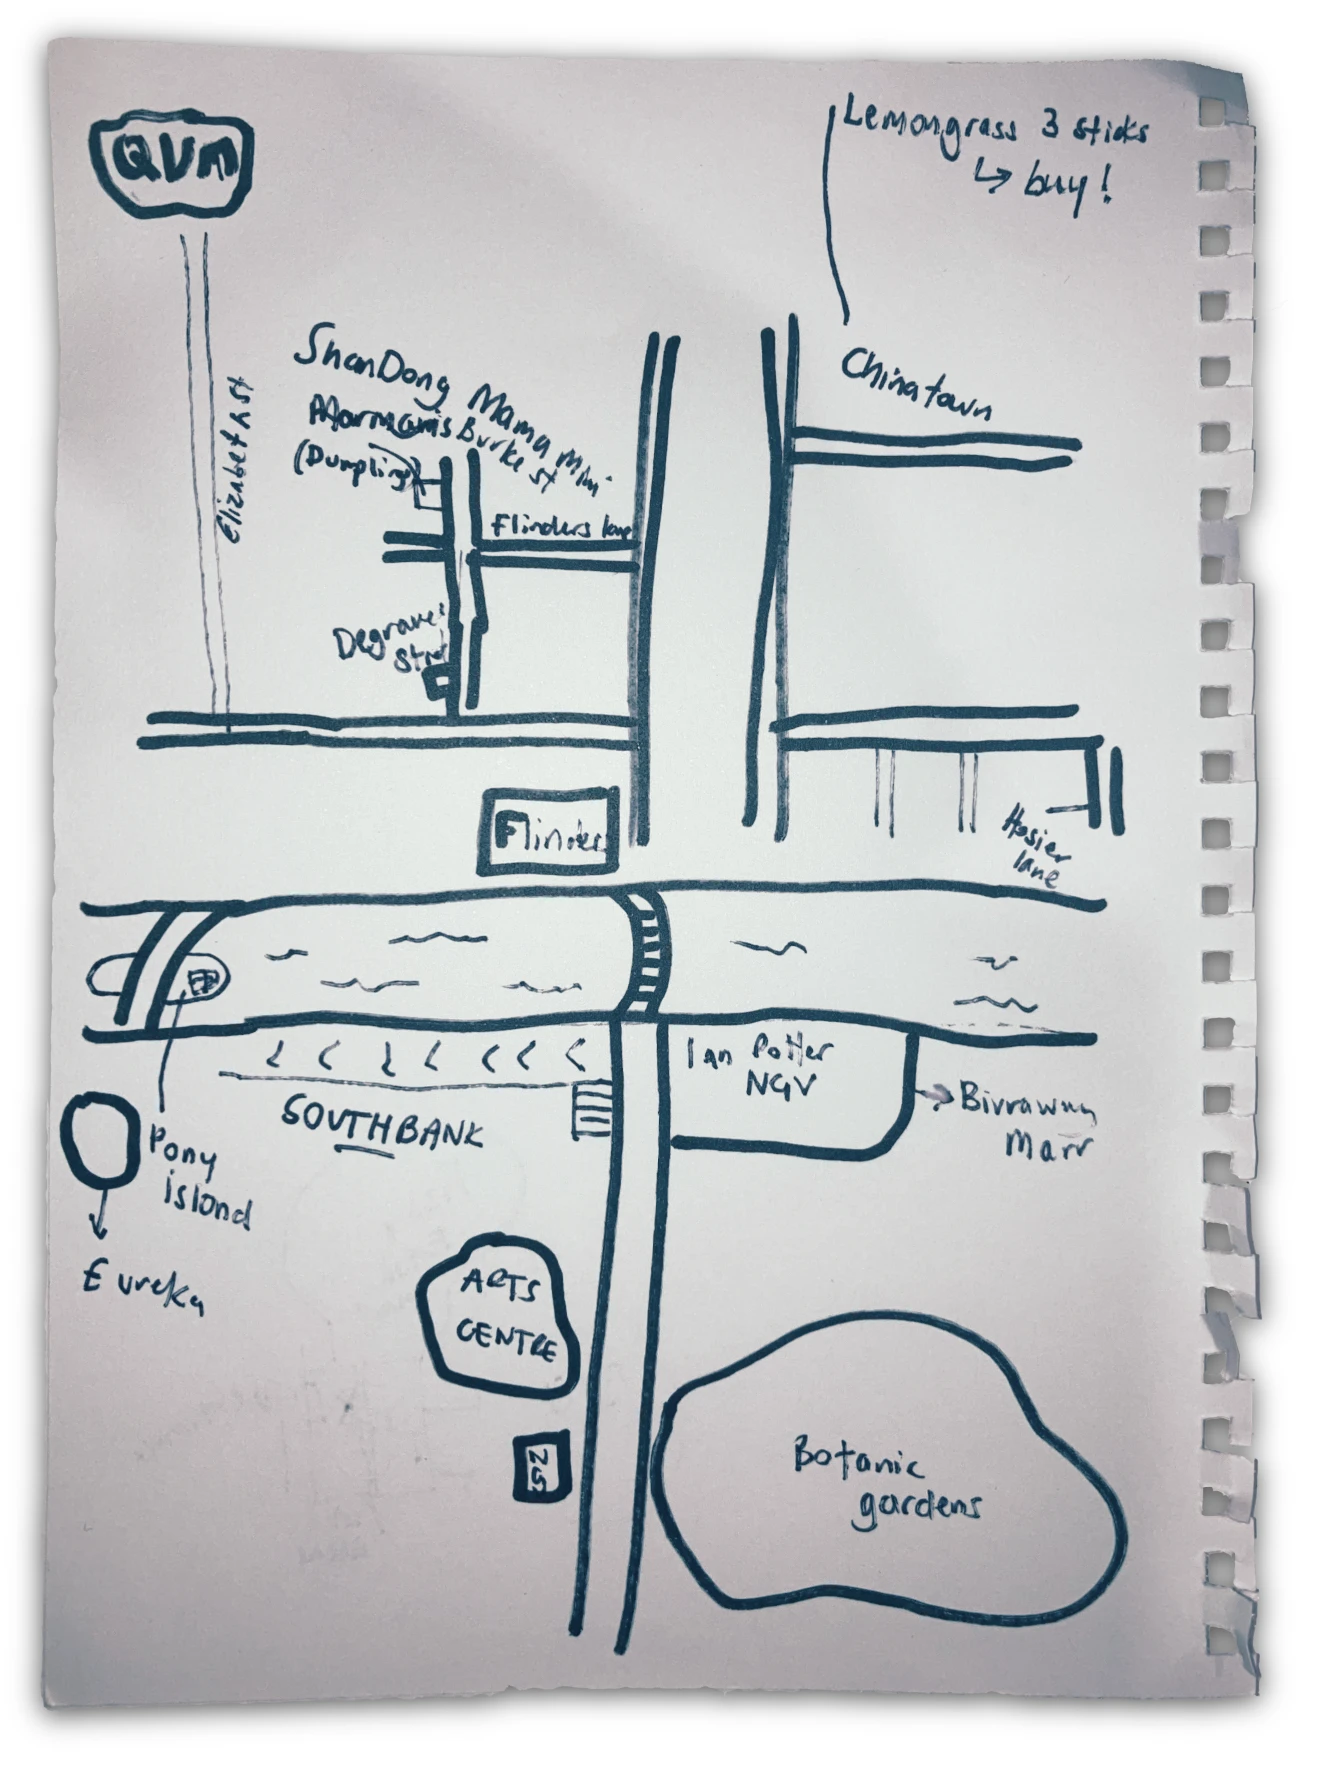
— Hand-drawn map of Melbourne’s inner city, for visitors. Includes directions where to buy lemongrass for dinner.
Saturday, 05 November 2022
— In the UK, true north, grid north, and magnetic north will be aligned in the coming years at different places around the country. If you’re around Poole in the coming weeks, you can trust your compass for once.
Wednesday, 02 November 2022
— Hoodmaps classifies neighbourhoods in cities worldwide according to their vibe. In London, the map shows people in Sydenham are rich, and hip in Selhurst. Whoever provided the data has clearly never been to South London.
Tuesday, 18 October 2022
Lots of fresh air, exercise, creating something with your hands, a girl to help — map-making in the sixties must have been a splendid vocation.
(via The Map Room)